The Employment Situation in July
By Chair Cecilia Rouse
Today’s jobs report showed the economy added 943,000 jobs in July, for an average gain of 832,000 over the last three months. This is the fastest monthly job growth since August of last summer. Job gains in May and June were both revised up. In addition, the unemployment rate fell by 0.5 percentage point and labor force participation ticked up by 0.1 percentage point.
While this is a strong monthly report, it is important to focus on the trend of job growth. In addition, the economic recovery will not be complete until the public health situation is under control, as reinforced by the rise of Covid cases associated with the Delta variant.
1. Job growth over the last three months has averaged more than 800,000, up from earlier in the year.
Average job growth from May to July was 832,000 jobs a month (see Figure 1). Since monthly numbers can be volatile, it is important to focus on the three-month average rather than the data in a single month, as described in a recent CEA blog. The three-month average increased in July, reflecting particularly strong job growth in June and July.

However, our economy has not fully recovered as employment remains about 5.7 million jobs below its pre-pandemic level.
2. The strong job growth in July was driven by gains in the leisure and hospitality and government sectors.
The leisure and hospitality industry added 380,000 jobs in July, resulting in average job growth of 364,000 jobs over the last three months. The second largest job growth occurred in the government sector, with an increase of 240,000 jobs, concentrated in local education.
Seasonal factors affected job growth in July, mostly in the education sector (the large seasonal impacts on government were concentrated in State and local education). Usually, the State and local education sector loses about 1.2 million jobs in July as the school year ends. However, the school year was disrupted due to the pandemic, and there were fewer State and local education employees on payroll to lay off. Thus, although 962,000 State and local education employees were laid off on a not seasonally adjusted basis, the sector added about 230,000 jobs on a seasonally adjusted basis because there were fewer layoffs than occur in a typical year. As Figure 2 shows, the effect of the seasonal adjustment in July was particularly large in the State and local government education sector. For instance, the leisure and hospitality sector added 380,000 jobs seasonally adjusted and 439,000 jobs not seasonally adjusted.

It is unclear how seasonal adjustment factors will interact with hiring and planning for the school year this fall.
3. The unemployment rate dropped to its lowest rate in the pandemic recovery.
The unemployment rate fell 0.5 percentage point to 5.4 percent—the lowest it has been since the pandemic began. The decline in the overall unemployment rate was due to job-seekers finding jobs: the employment-population ratio rose 0.4 percentage point to a new pandemic high.
The decline in the unemployment rate was largest for Black workers (1.0 percentage point) and Hispanic workers (0.8 percentage point); however, the decline for Black workers partly reflected a substantial drop in labor force participation. The July unemployment rates for white, Black, and Hispanic workers were the lowest they have been in the pandemic, although for Asian workers the July unemployment rate was slightly above its February 2021 level. Movements in labor statistics for demographic groups from month to month are often noisy.

The Black and Hispanic unemployment rates were still substantially elevated above the white unemployment rate.
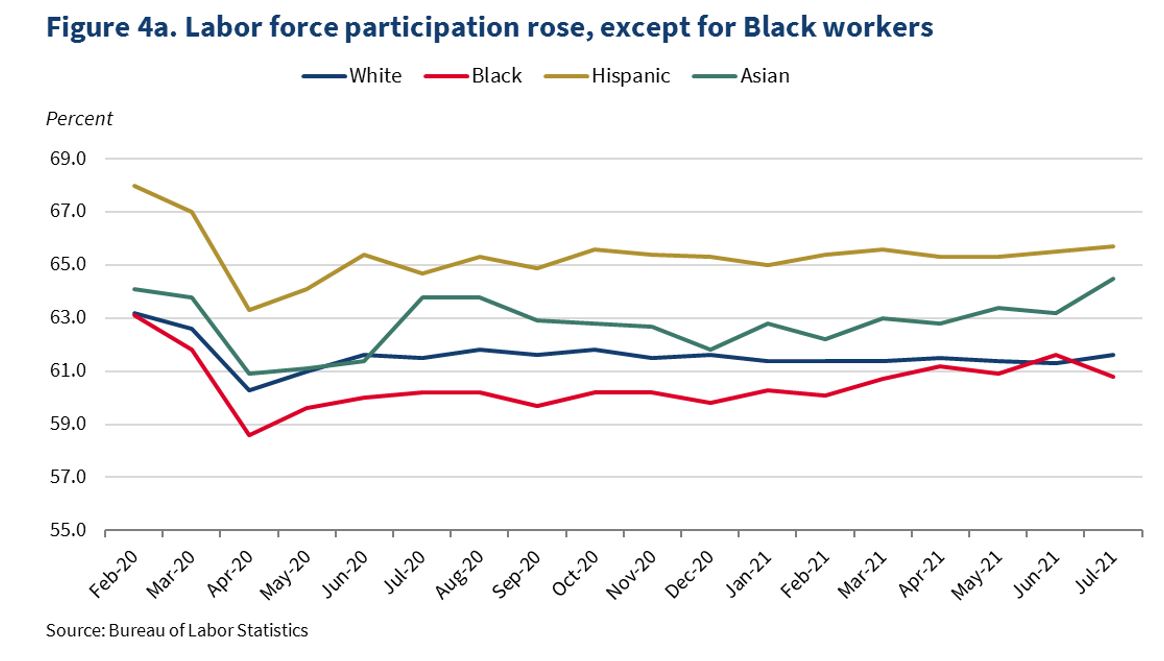
4. Labor force participation ticked up 0.1 percentage point, but the number of people not looking for work due to the pandemic held steady. In addition, the headline increase masked differences across demographic groups.
The labor force participation rate ticked up slightly to 61.7 percent, returning to the pandemic high reached in April 2021 and August 2020. However, 1.6 million people did not search for work in July because of the pandemic, a number that was essentially unchanged from June and the first month without a significant decline in this series since January 2021. While two months do not make a trend, this data point is a reminder that further improvements in labor force participation may continue to be impacted by the public health situation.
Not all demographic groups experienced an increase in their labor force participation rate. While last month the participation rate for Black workers was actually higher than it was for white workers (which is unusual), the participation rate for Black workers fell 0.8 percentage point in July while it rose for white workers. Meanwhile, the Asian labor force participation rate rose 1.3 percentage points and is now above its pre-pandemic level. As noted above, movements in labor statistics for demographic groups from month to month are often noisy.

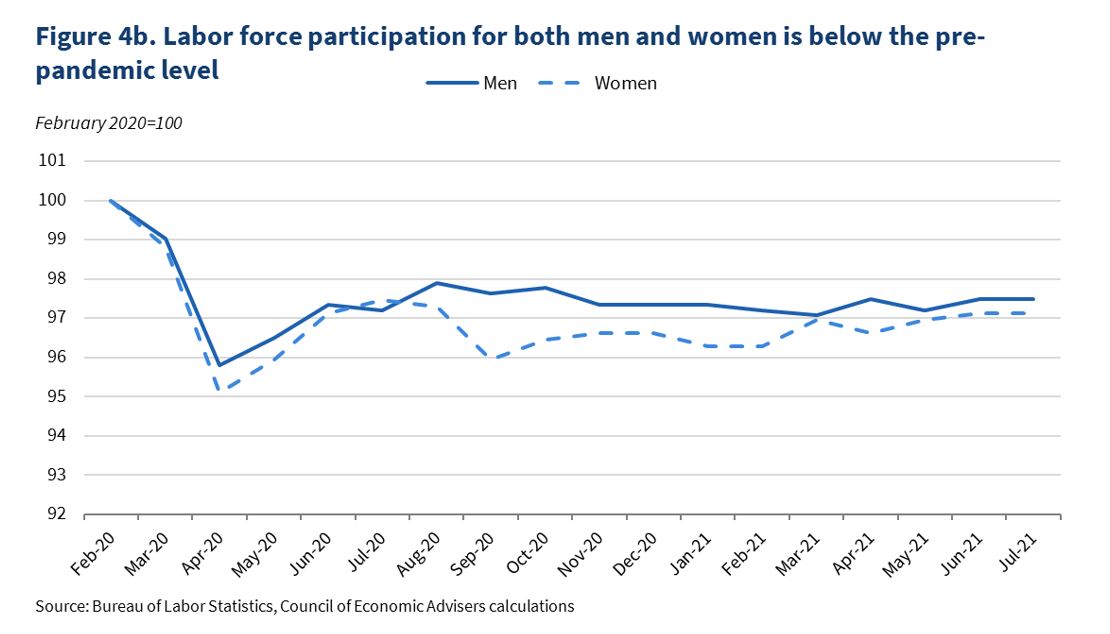
Labor force participation for adult men and women held steady in July. Men’s labor force participation has recovered slightly more than that of women, although the gap has closed since last fall.

5. The prime-age (25 to 54) employment-population ratio rose 0.6 percentage point.
As the headline unemployment rate fell and employment rose, employment gains were particularly large for prime-age workers (25 to 54). Economists often focus on prime-age workers because their employment is not substantially impacted by schooling or retirement decisions. However, the prime-age employment rate is still about three percent below where it was pre-pandemic.

As the Administration stresses every month, the monthly employment and unemployment figures can be volatile, and payroll employment estimates can be subject to substantial revision. Therefore, it is important not to read too much into any one monthly report, and it is informative to consider each report in the context of other data as they become available.

