The Employment Situation in January
By Chair Cecilia Rouse
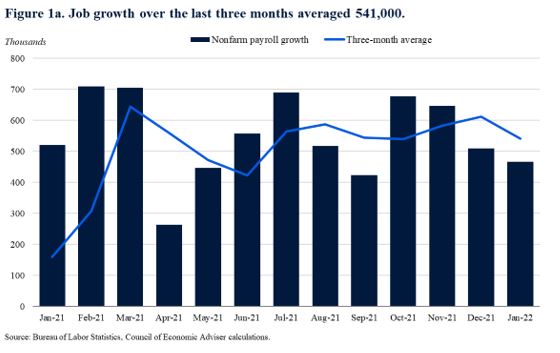
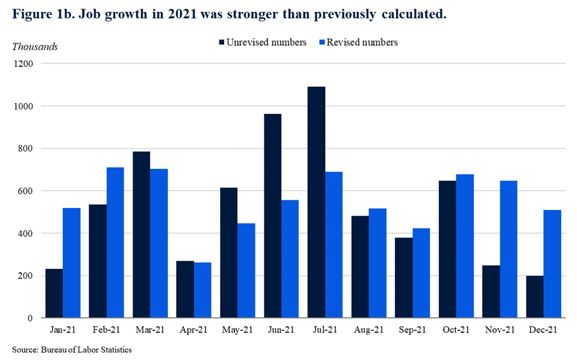
Today’s jobs report shows that the economy added 467,000 jobs in January, for an average monthly gain of 541,000 over the past three months. The number of jobs added in January came in well above market expectations. This report also contains the annual benchmark revision for 2021 as well as updates to the BLS seasonal adjustment model. Together with the usual two-month revisions, employment was revised up by 217,000 jobs in 2021.
The unemployment rate ticked up by 0.1 percentage point to 4.0 percent. The labor force participation rate was 62.2 percent, reaching a new pandemic high. BLS adjusted both the employment-to-population ratio and the labor force participation rate higher in January 2022 to reflect new population estimates. Wages rose by 0.7 percent over the month, for an increase of 5.7 percent year-over-year. Wage growth has been relatively rapid in recent months as the economy recovers and employers ramp up hiring.
As the Council of Economic Advisers has emphasized every month, it is important to focus on data trends across multiple months, because data can be volatile on a month-to-month basis.
- Average monthly job growth over the last three months was 541,000, a fast pace.
Job growth from November to January averaged 541,000 jobs per month (see Figure 1a). Since monthly numbers can be volatile and subject to revision, the Council of Economic Advisers prefers to focus on the three-month average rather than the data in a single month, as described in a prior CEA blog.

BLS also made three sets of revisions to 2021 data. The first was their normal two-month revision, affecting November and December jobs numbers. The second was their annual benchmark revision. The third was an update to their seasonal adjustment procedure. Taken all together, these adjustments added 217,000 jobs to job growth in 2021, resulting in a total of 6.7 million jobs added over the year (Figure 1b). In addition, these revisions smoothed some of the volatility in monthly job growth previously seen in 2021.

Nevertheless, the labor market has not fully recovered: employment remains about 2.9 million jobs (1.9 percent) below the pre-pandemic level.
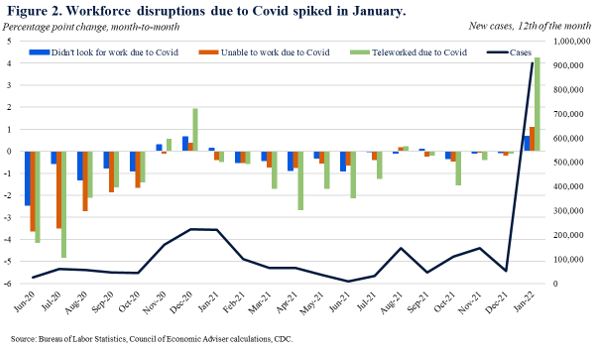
2. Despite the solid jobs growth, Omicron affected the labor market in January, as seen in the number of workers absent and the number of people who said their labor market decisions were affected by COVID.
January saw a surge in workers reporting a work disruption, likely due to the effects of the Omicron variant. For instance, on January 12th, there were more than 900,000 new cases, a significant rise from December. As a result, all the measures of COVID workforce disruption tracked by the Bureau of Labor Statistics had their fastest increase since data began being collected in May 2020 (Figure 2).
In addition, 3.6 million workers did not work the entire week of January 9th-15th due to their own illness, injury, or medical problem, the highest level of health-related work absences on record (since 1976). Over 4 million workers who usually work full-time worked part-time in that week due to a health-related reason, also a series high.
3. Average weekly hours fell in January, also likely reflecting Omicron.
The average length of the workweek fell in January by 0.2 hour per week, likely reflecting the effects of Omicron on employee availability and demand (Figure 3).

Notably, average weekly hours fell by a full hour in the retail trade industry, by 0.7 hours in mining and logging, and by 0.3 hours in leisure and hospitality as well as construction.
4. Labor force participation grew by 0.8 percentage point year-over-year, a fast pace.
The labor force participation rate was 62.2 percent in January, up from 61.4 percent a year ago. This increase is a relatively fast pace historically for a participation increase. The increase in the participation rate between December and January entirely reflected revisions to underlying population estimates reflecting the 2020 Census results.
The “prime-age” (25 to 54) labor force participation rate was 82.0 percent, up from 81.1 percent a year ago, similarly a fast increase and unaffected by the population revisions mentioned above (Figure 4). The Council of Economic Advisers prefers to look at the prime-age labor force participation rate because it is less impacted by changes in educational enrollment and the natural slowdown in labor force participation caused by the aging of the population and retirements.

5. Wage growth has been strong in recent months, including when looking at a measure that controls for compositional issues.
Average hourly earnings grew 5.7 percent over the last 12 months, a very strong nominal pace. This measure however can be skewed by what economists call “compositional effects” as workers of different wage levels get laid off or hired. The Employment Cost Index (ECI) is a different wage measure that adjusts for compositional effects. Looking at the three-month percent change for both average hourly earnings and ECI, wage growth has trended up in recent months (Figure 5).

Given that monthly wage growth in January rose by 0.7 percent, it is unclear whether monthly wage growth will outpace inflation, but over the year real wages likely fell.
6. Monthly data for American Indian and Alaska Native workers was published for the first time, showing a substantially higher unemployment rate.
Starting with this report, the Bureau of Labor Statistics will report a monthly unemployment rate for American Indian and Alaska Native workers. In January, the unemployment rate not seasonally adjusted for this group was 11.1 percent, substantially higher than for the population as a whole (Figure 6). In April 2020, the height of the economic impacts of the pandemic, the unemployment rate for this population reached almost 30 percent.

As the Administration stresses every month, the monthly employment and unemployment figures can be volatile, and payroll employment estimates can be subject to substantial revision. Therefore, it is important not to read too much into any one monthly report, and it is informative to consider each report in the context of other data as they become available.


